Data Charts
We use ApexCharts to create the chart for the data. It uses webviewbridge to create the chart.
It works by passing in the data and the options.
For more information on ApexCharts, please visit:
https://apexcharts.com/javascript-chart-demos/line-charts/basic/
WebviewbridgeSimple Example
- Page
- Page Design
import ChartExampleDesign from 'generated/pages/chartExample';
import { withDismissAndBackButton } from '@smartface/mixins';
import { Router, Route } from '@smartface/router';
import WebViewBridge from '@smartface/webviewbridge';
import Chart from '@smartface/extension-utils/lib/chart';
export default class ChartExample extends withDismissAndBackButton(ChartExampleDesign) {
chartOptions = {
series: [
{
name: 'Desktops',
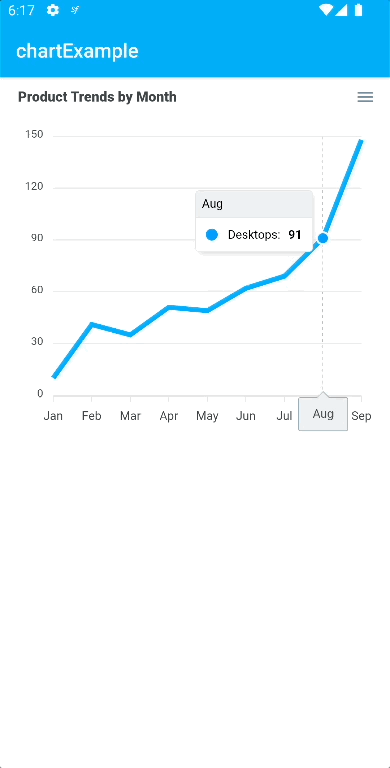
data: [10, 41, 35, 51, 49, 62, 69, 91, 148]
}
],
chart: {
height: 350,
type: 'line',
zoom: {
enabled: false
}
},
dataLabels: {
enabled: false
},
stroke: {
curve: 'straight'
},
title: {
text: 'Product Trends by Month',
align: 'left'
},
grid: {
row: {
colors: ['#f3f3f3', 'transparent'], // takes an array which will be repeated on columns
opacity: 0.5
}
},
xaxis: {
categories: ['Jan', 'Feb', 'Mar', 'Apr', 'May', 'Jun', 'Jul', 'Aug', 'Sep']
}
};
constructor(private router?: Router, private route?: Route) {
super({});
}
/**
* @event onShow
* This event is called when the page appears on the screen (everytime).
*/
onShow() {
super.onShow();
this.initBackButton(this.router); //Addes a back button to the page headerbar.
const wvb = new WebViewBridge({
webView: this.myWebView
});
const chart = new Chart({
//@ts-ignore
webViewBridge: wvb,
apexOptions: {
series: [
{
name: 'Desktops',
data: [10, 41, 35, 51, 49, 62, 69, 91, 148]
}
],
chart: {
height: 350,
type: 'line',
zoom: {
enabled: false
}
},
dataLabels: {
enabled: false
},
stroke: {
curve: 'straight'
},
title: {
text: 'Product Trends by Month',
align: 'left'
},
grid: {
row: {
colors: ['#f3f3f3', 'transparent'], // takes an array which will be repeated on columns
opacity: 0.5
}
},
xaxis: {
categories: ['Jan', 'Feb', 'Mar', 'Apr', 'May', 'Jun', 'Jul', 'Aug', 'Sep']
}
}
});
chart.render();
}
/**
* @event onLoad
* This event is called once when the page is created.
*/
onLoad() {
super.onLoad();
}
}
{
    "components": [
        {
            "className": ".sf-page",
            "id": "bab5-44a8-7bca-0198",
            "initialized": true,
            "props": {
                "children": [
                    "0caf-c2a6-3b6d-40bf",
                    "75ee-b09d-c4e5-6297",
                    "59a3-6180-133e-be4c"
                ],
                "name": "chartExample",
                "orientation": "PORTRAIT",
                "parent": null
            },
            "type": "Page",
            "userProps": {},
            "version": "0.0.1.a"
        },
        {
            "className": ".sf-statusBar",
            "id": "0caf-c2a6-3b6d-40bf",
            "props": {
                "children": [],
                "isRemovable": false,
                "name": "statusBar",
                "parent": "bab5-44a8-7bca-0198"
            },
            "type": "StatusBar",
            "userProps": {}
        },
        {
            "className": ".sf-headerBar",
            "id": "75ee-b09d-c4e5-6297",
            "props": {
                "children": [],
                "isRemovable": false,
                "name": "headerBar",
                "parent": "bab5-44a8-7bca-0198",
                "title": "chartExample"
            },
            "type": "HeaderBar",
            "userProps": {
                "title": "chartExample"
            }
        },
        {
            "className": ".sf-webView",
            "id": "59a3-6180-133e-be4c",
            "oldName": "webView1",
            "props": {
                "children": [],
                "name": "myWebView",
                "parent": "bab5-44a8-7bca-0198",
                "usePageVariable": true
            },
            "ref": null,
            "type": "WebView",
            "userProps": {
                "flexProps": {
                    "flexGrow": 1
                },
                "height": -1,
                "testId": "MR7CYHCx2",
                "usePageVariable": true
            }
        }
    ]
}